At a Glance: Gawler Property Market — 4 May to 3 August 2026
Key market findings from 118 confirmed residential sales across the Gawler district between 4 May and 3 August 2026.
| Metric | Value |
|---|---|
| Median House Price | $800,000 |
| Total Confirmed Sales | 118 |
| Sales with Disclosed Prices | 104 |
| Contact Agent (Undisclosed) | 14 |
| Lowest Sale | $525,000 |
| Highest Sale | $1,850,000 |
| Most Active Price Band | $700,000–$749,99916 sales |
| 3-Bedroom Median | $710,00044 sales |
| 4-Bedroom Median | $850,00046 sales |
| 5-Bedroom Median | $965,00012 sales |
| Strongest Suburb Medians | Gawler Belt $1,162,500 · Hewett $970,0009 & 13 disclosed sales respectively |
| Most Active Suburb | Gawler East$782,500 median · 22 disclosed sales |
| Previous Period Median | $740,0004 Feb 2026 – 3 May 2026 |
| Data Source | realestate.com.au |
| Report Period | 4 May 2026 – 3 August 2026 |
This is a 90-day rolling snapshot. For the current month's headline figures and broader/longer-term price context, see the Gawler house prices pillar page, updated monthly.
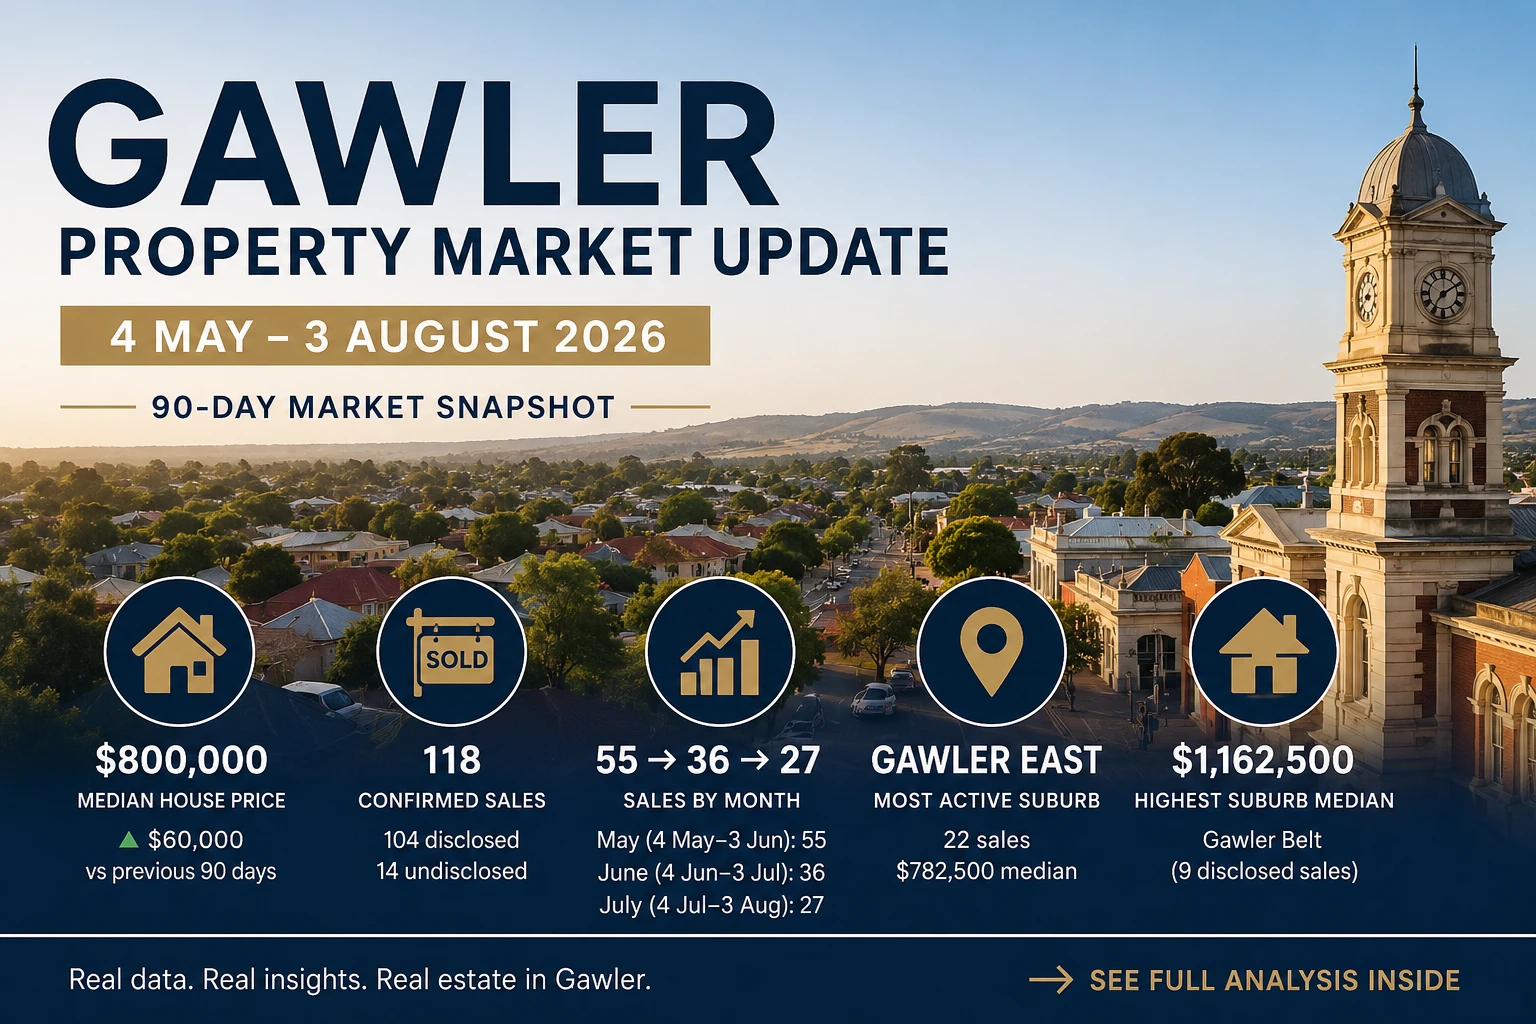
Between 4 May and 3 August 2026, the Gawler district recorded 118 confirmed residential sales, with 104 disclosing a sale price and 14 listed as Contact Agent. The median house price — calculated exclusively from the 104 publicly disclosed transactions — was $800,000, with the lowest recorded sale at $525,000 and the highest at $1,850,000. The 3-bedroom median was $710,000 from 44 sales, the 4-bedroom median was $850,000 from 46 sales, and the 5-bedroom median was $965,000 from 12 sales. The most active price band was $700,000–$749,999, accounting for 16 of 104 disclosed transactions. Gawler East recorded the highest volume with 22 disclosed sales and a median of $782,500, while Gawler Belt and Hewett recorded the strongest suburb medians at $1,162,500 and $970,000 respectively. The previous three-month period (4 February–3 May 2026) recorded a median of $740,000 from 73 disclosed sales.
What the $800,000 Median Really Tells Us
But underneath that number: the 3-bedroom median held exactly flat at $710,000, and the 4-bedroom median rose only $5,000 (to $850,000). The $60,000 isn't broad market growth — it's a run of high-value Gawler Belt, Hewett and Gawler South sales pulling the headline figure upward.
Gawler's headline median has risen from $740,000 to $800,000, but the underlying market is more stable than that figure suggests. The 3-bedroom median — the district's most actively traded segment — landed at exactly $710,000, identical to the previous period. The 4-bedroom median moved just $5,000, to $850,000. Most of the headline increase came from a stronger concentration of high-value sales in Gawler Belt, Hewett and Gawler South, not from a broad-based lift across the district. For the longer-term, evergreen price picture, see the Gawler house prices pillar page.
Gawler Property Market — May, June and July Compared
The Gawler district recorded 118 confirmed residential sales between 4 May and 3 August 2026, with 104 disclosing a sale price. The median house price — calculated exclusively from the 104 publicly disclosed transactions — was $800,000, a $60,000 rise on the previous rolling period.
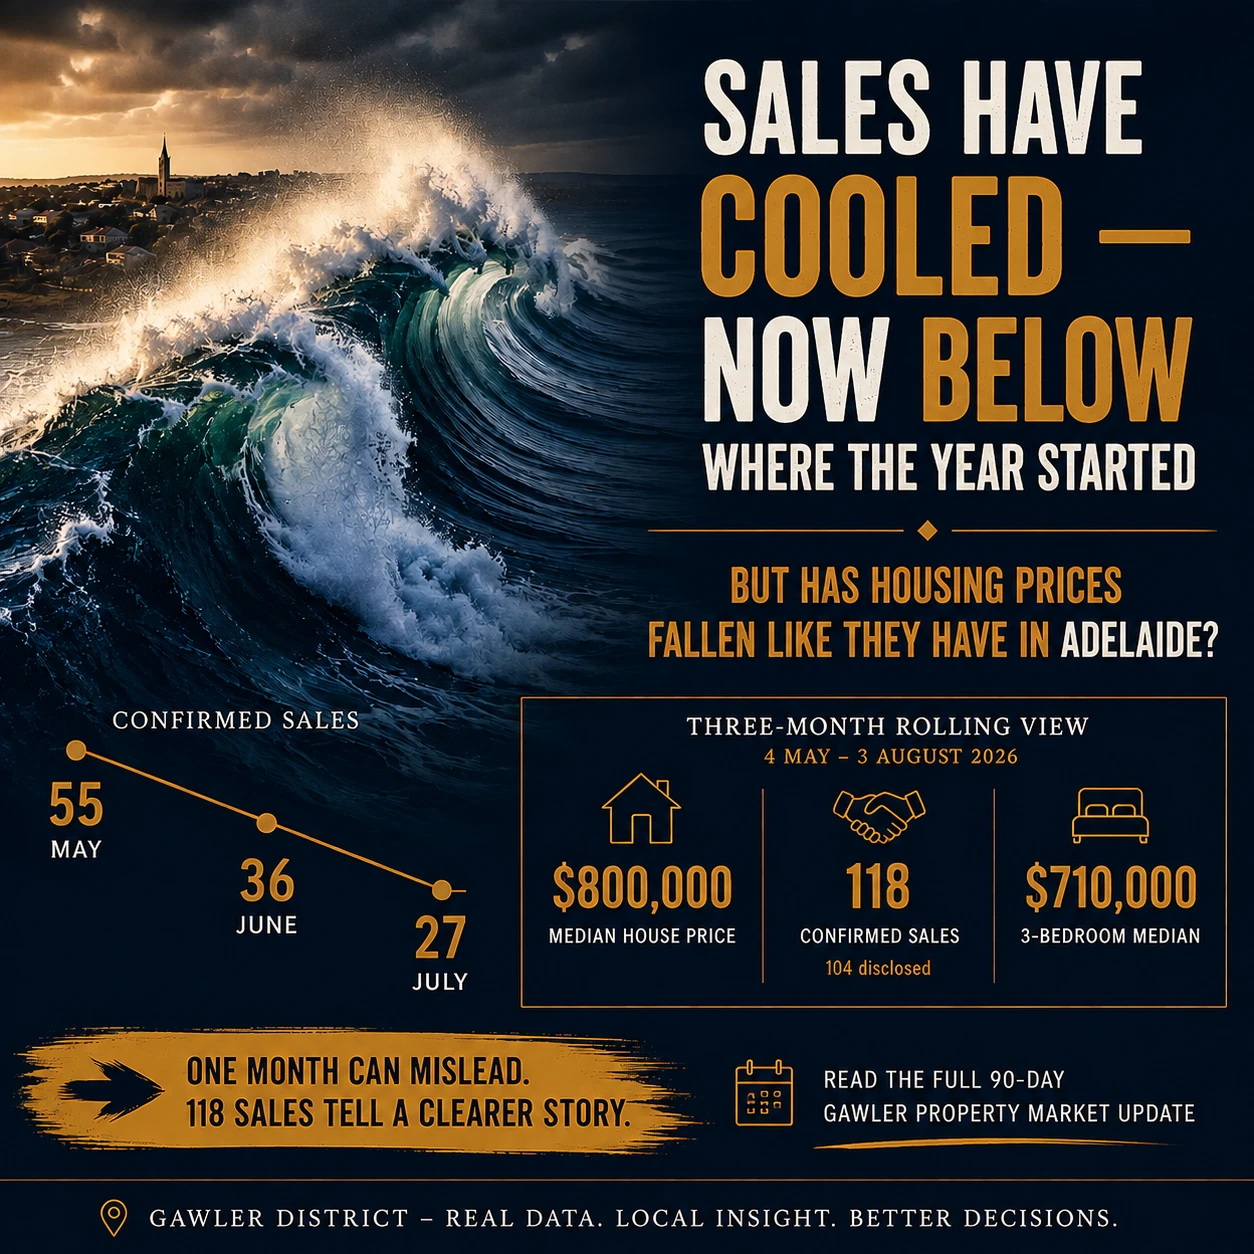
The timing of the May surge coincided with the 12 May 2026 Federal Budget announcement and the market's response to proposed changes to negative gearing and capital gains tax treatment. The dataset records 55 confirmed sales during the May portion of this window, 36 during June, and 27 during July — a pattern consistent with a short-term pull-forward of activity into May followed by a correction, although the sales data alone cannot establish how much of the May increase was directly attributable to the Budget.
The most active price band was $700,000–$749,999, which recorded 16 property sales — 15% of all disclosed transactions. This is a narrower share than the previous period's equivalent band (26%), reflecting more activity spread through the $750k–$1.1m range this period, consistent with the premium-suburb concentration (Gawler Belt, Hewett, Gawler South) discussed below.
Read more: 2026 Federal Budget — Gawler Property Market Analysis.
About This Dataset & the Gawler Region
The table below summarises key statistics from the Gawler district residential sales dataset for the period 4 May to 3 August 2026.
The suburbs included in this report — Gawler, Gawler East, Gawler West, Gawler South, Willaston, Evanston, Evanston Park, Evanston Gardens, Evanston South, Hewett, and Gawler Belt — are neighbouring communities that together form the broader Gawler district.
This 90-day rolling report provides a broader sample than a single month's data, allowing recent market movements to be assessed across 104 disclosed sales.
Gawler Region Residential Sales — Dataset Summary (4 May to 3 August 2026)
| Field | Detail |
|---|---|
| Reporting Period | 4 May 2026 – 3 August 2026 |
| Report Type | Three-month rolling |
| Suburbs Included | Gawler, Gawler East, Gawler South, Gawler West, Willaston, Evanston, Evanston Gardens, Evanston Park, Evanston South, Hewett, Gawler Belt |
| Total Sales Recorded | 118 |
| Sales with Disclosed Prices | 104 |
| Contact Agent (Undisclosed) | 14 |
| Median Sale Price | $800,000 |
| Previous Period Median | $740,000 (4 Feb 2026 – 3 May 2026, 73 disclosed sales) |
| Lowest Sale Price | $525,000 |
| Highest Sale Price | $1,850,000 |
| Most Active Price Band | $700,000 – $749,999 (16 sales) |
| 3-Bedroom Median | $710,000 (44 sales) |
| 4-Bedroom Median | $850,000 (46 sales) |
| 5-Bedroom Median | $965,000 (12 sales) |
| Highest Suburb Median | Gawler Belt — $1,162,500 (9 disclosed sales) |
| Source | realestate.com.au — compiled by Gawler East Real Estate, RLA248695 |
Data Source
All sales data sourced from realestate.com.au confirmed sold listings for the Gawler region. Only sales with publicly disclosed prices are used when calculating median values and price ranges. Recorded sales listed as Contact Agent are included in the total count but excluded from all median and price range calculations. Compiled by Andrew McKiggan, Gawler East Real Estate, RLA248695.
How Many Houses Sold in the Gawler District — 4 May to 3 August 2026?
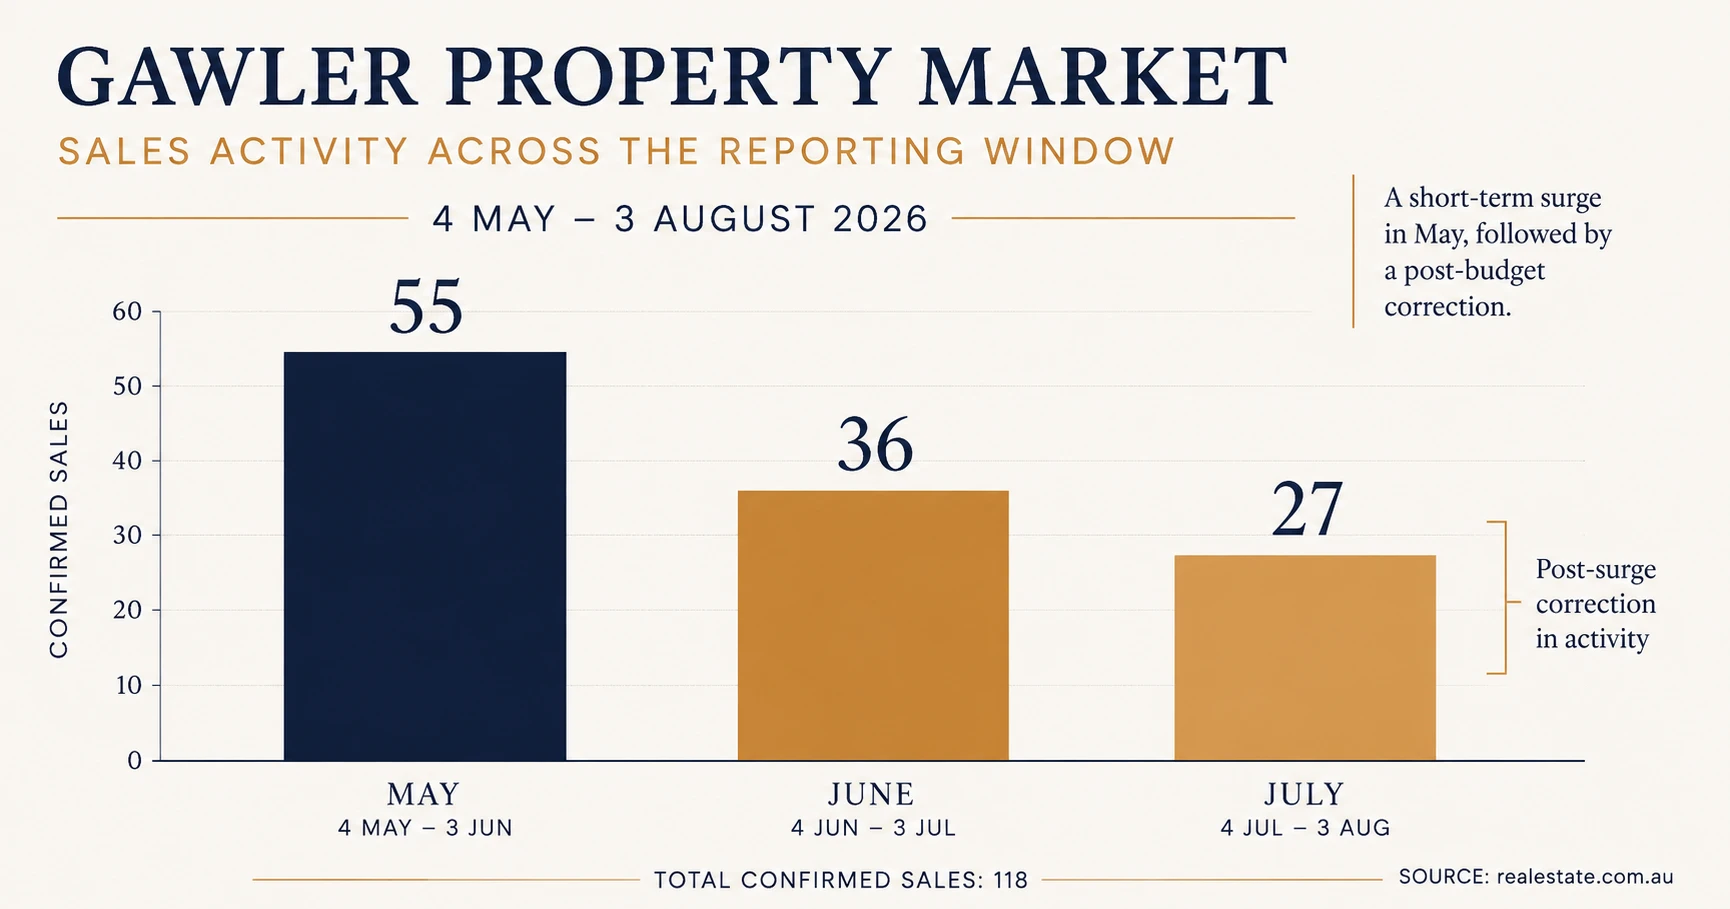
118 confirmed residential sales were recorded across the Gawler district between 4 May and 3 August 2026 — compared with 90 total sales in the previous period (4 February–3 May 2026), a genuine increase in volume across the window as a whole. Within the period, activity was not evenly spread.
A sharp fall from May's surge, followed by a partial stabilisation in July. The timing lines up with the 12 May 2026 Federal Budget announcement and its proposed changes to negative gearing and capital gains tax treatment. The data shows a clear change in activity — it doesn't prove the Budget caused it.
Monthly Sales Activity Within the Period
| Month | Total Sales | Disclosed | Median (Disclosed) |
|---|---|---|---|
| May (4 May–3 Jun) | 55 | 53 | $800,000 |
| June (4 Jun–3 Jul) | 36 | 32 | $782,500 |
| July (4 Jul–3 Aug) | 27 | 19 | $810,000 |
May recorded the strongest volume of the period, followed by a sharp fall in June and a partial recovery in July. The median held broadly steady across all three months — $800,000, $782,500 and $810,000 — showing that while transaction volume swung sharply, pricing itself moved far less than volume did.
For the individual month-by-month breakdowns, see May 2026, June 2026 and July 2026.
What the Latest 90 Days Tell Us About Prices
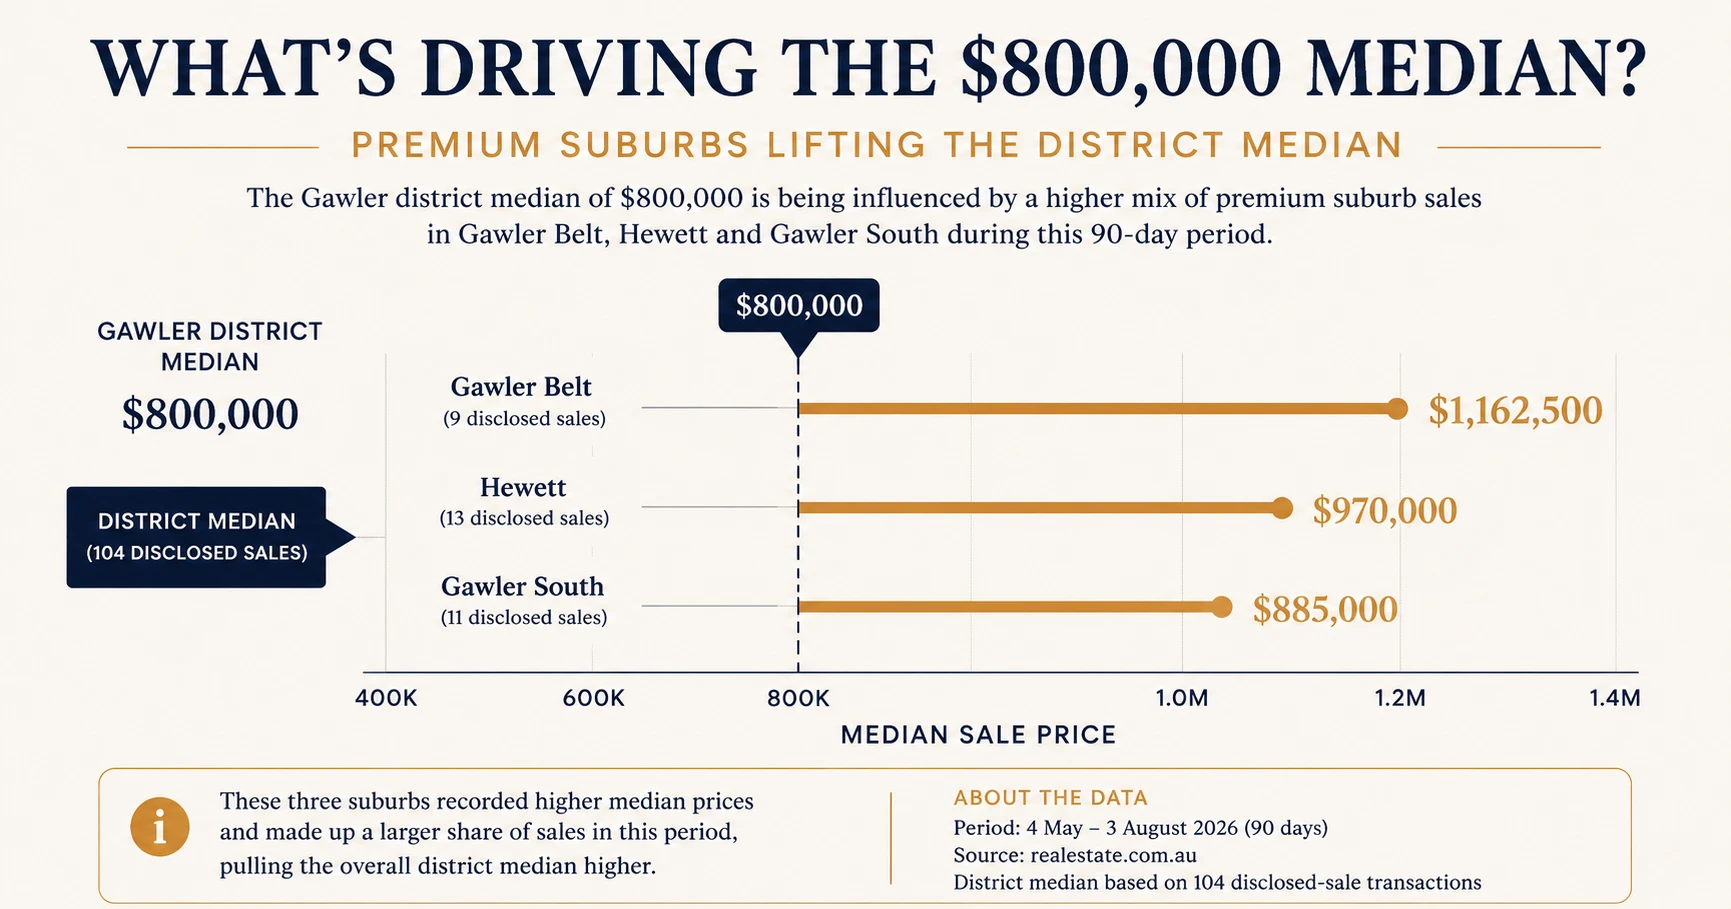
The median house price across the Gawler region for 4 May to 3 August 2026 was $800,000, calculated exclusively from the 104 publicly disclosed transactions (excluding 14 Contact Agent listings) — see above for what's driving that figure.
A concentrated run of high-value Gawler Belt, Hewett and Gawler South sales. Gawler Belt recorded four sales above $1.1 million this period (469 Redbanks Road $1,410,000; 4 Morony Drive $1,365,000; 52 Parkers Road $1,220,000; 1 Lange Road $1,200,000), lifting its median from a single-sale $730,000 last period to $1,162,500 across 9 disclosed sales this period. Gawler South also strengthened materially, to $885,000 from 11 disclosed sales.
One standout outlier. The highest sale in this period — $1,850,000 at 59 Cowan Street, Gawler — is a 4-bedroom property and the highest sale recorded in either of the last two rolling periods.
Gawler District Sales by Bedroom — What Does Each Extra Room Cost?
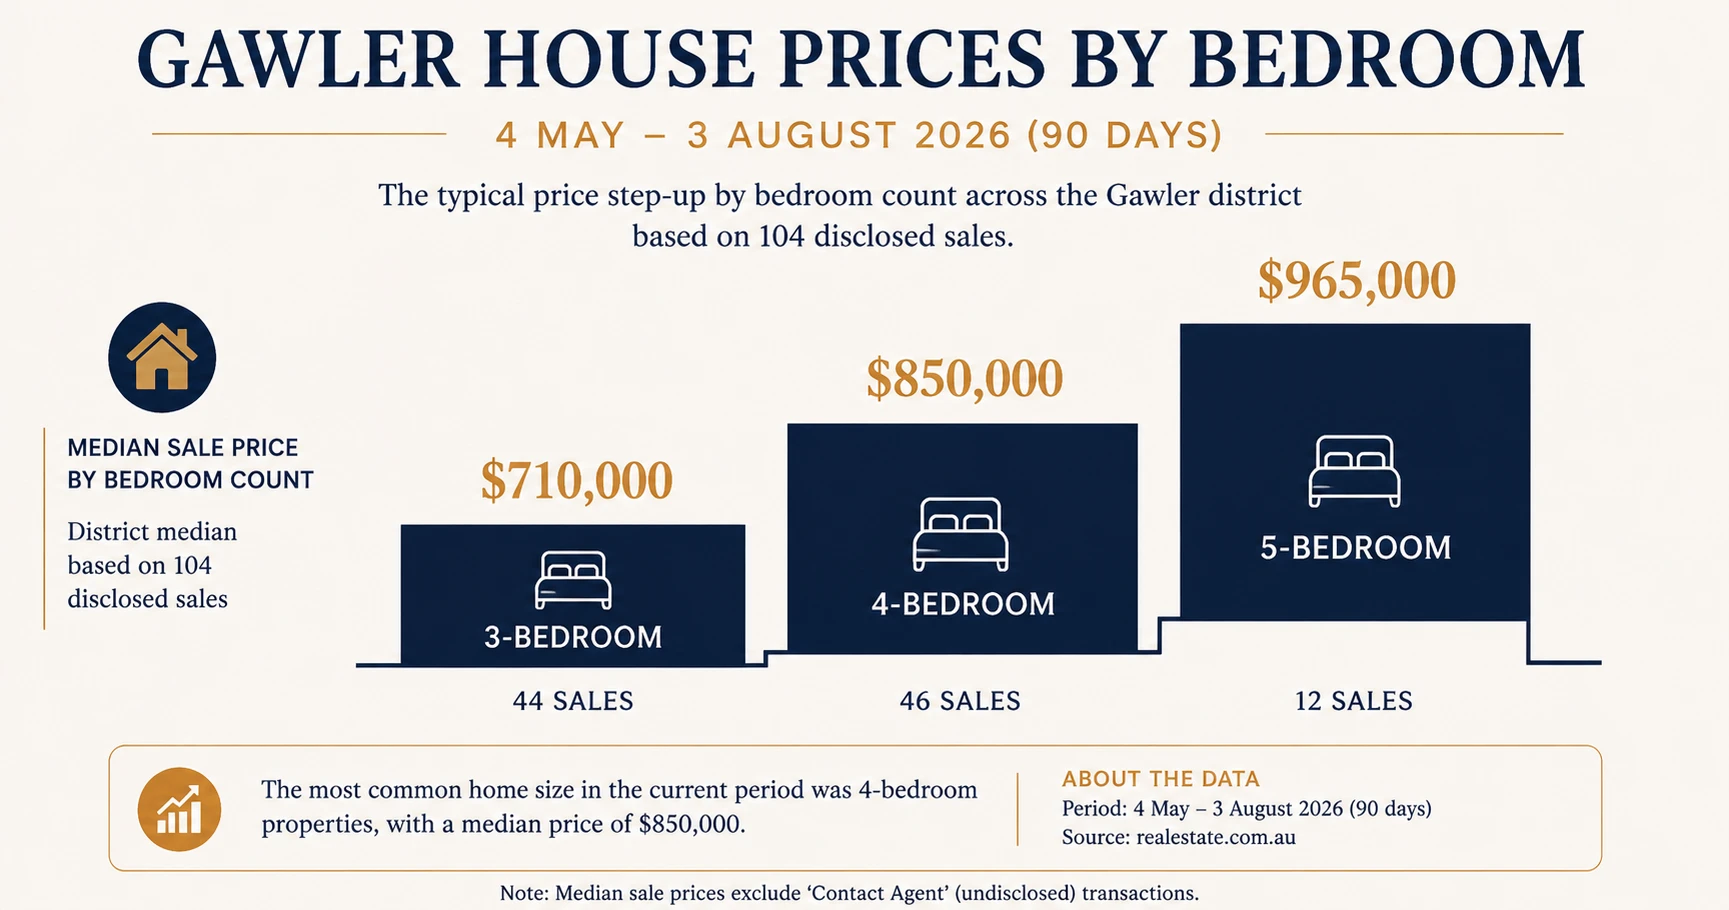
| Bedrooms | Disclosed Sales | Median Price | Lowest Sale | Highest Sale | vs Previous Period |
|---|---|---|---|---|---|
| 3-Bedroom | 44 | $710,000 | $525,000 | $1,150,000 | — flat (was $710,000) |
| 4-Bedroom | 46 | $850,000 | $550,000 | $1,850,000 | ▲ +$5,000 (was $845,000) |
| 5-Bedroom | 12 | $965,000 | $846,000 | $1,365,000 | ▲ +$17,000 (was $948,000) |
Note: 2 six-bedroom sales occurred this period (3 Morrow Avenue, Evanston Park $1,199,000; 3 Sullivan Grove, Gawler South $1,045,000) — these sit outside the standard 3/4/5-bed table and aren't included above.
The bedroom premium in Gawler SA: Moving from a 3-bedroom to a 4-bedroom home currently represents a median price step of approximately $140,000 across the district. Moving from 4-bedroom to 5-bedroom adds a further $115,000 at the median, though the 5-bedroom sample remains comparatively small (12 sales) and sensitive to which specific properties transact.
Gawler District Property Prices by Suburb — Where Did the Premium Sales Occur?
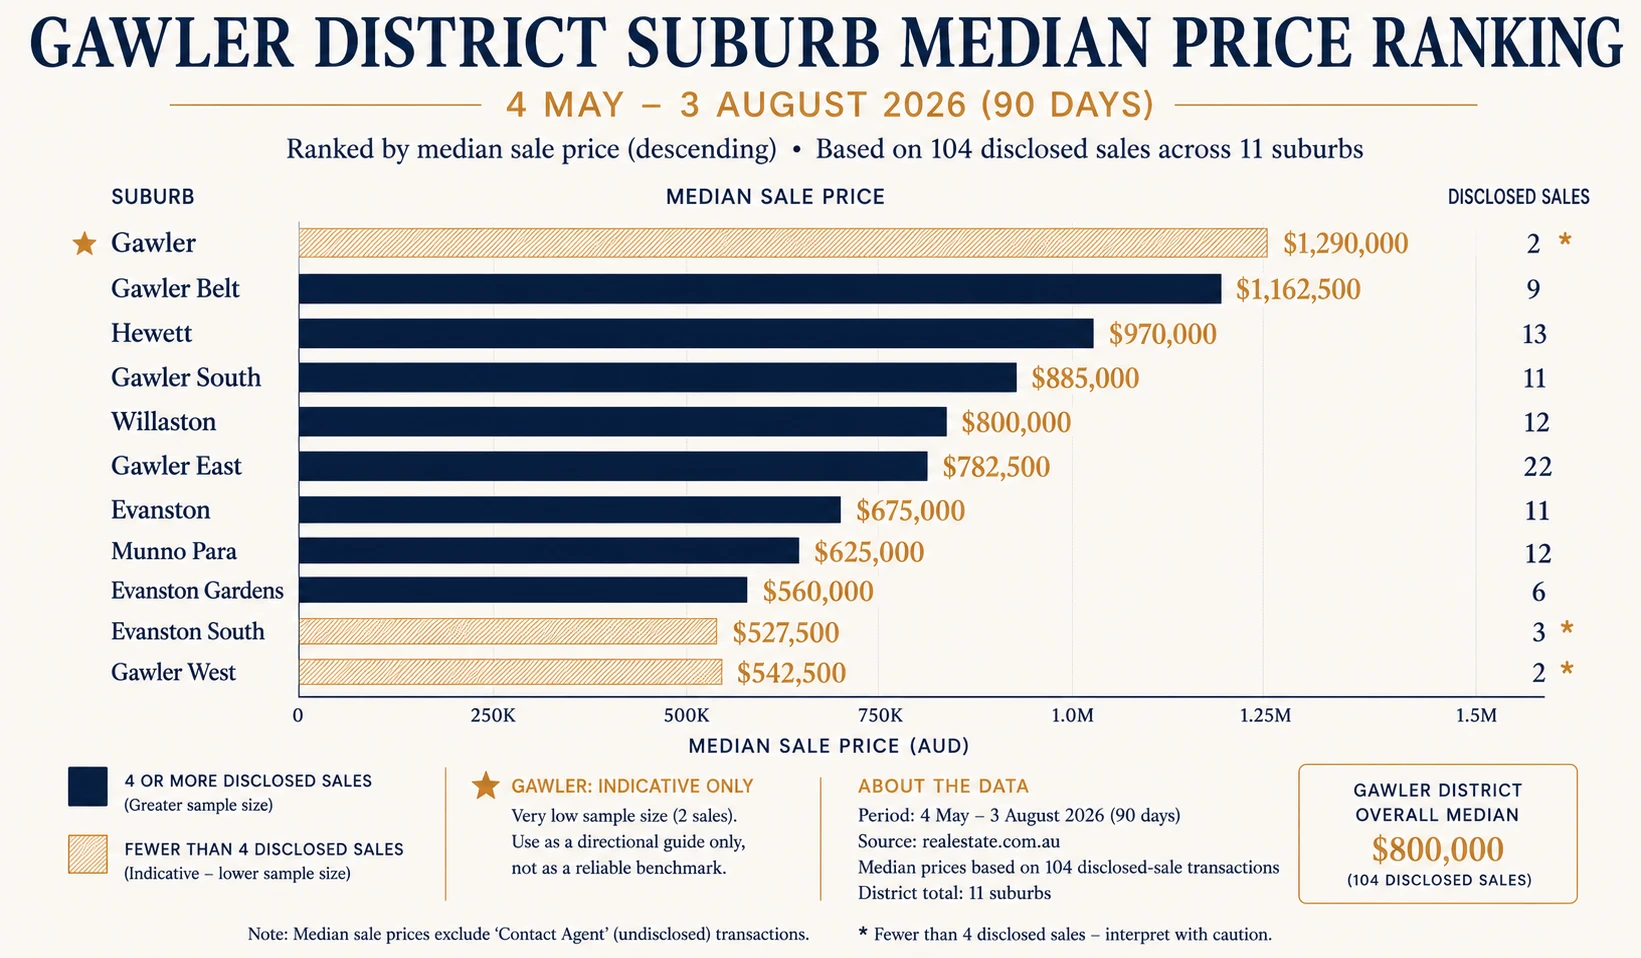
The suburb comparison below is based on sales with publicly disclosed prices only. Suburbs with fewer than ~4 disclosed sales should be treated as indicative — small samples produce significant variation period to period.
| Suburb | Total | Disclosed | Median | Low | High | vs Previous Period |
|---|---|---|---|---|---|---|
| GawlerIndicative only | 2 | 2 | $1,290,000 | $730,000 | $1,850,000 | ▲ (was $743,500, 3 sales) |
| Gawler Belt | 9 | 9 | $1,162,500 | $840,000 | $1,410,000 | ▲ +$432,500 (was $730,000, 1 sale) |
| Hewett | 15 | 13 | $970,000 | $787,500 | $1,305,000 | ▲ +$112,500 (was $857,500, 4 sales) |
| Gawler South | 11 | 11 | $885,000 | $550,000 | $1,060,000 | ▲ +$172,350 (was $712,650, 6 sales) |
| Gawler East | 22 | 22 | $782,500 | $674,000 | $1,150,000 | ▼ -$47,500 (was $830,000, 21 sales) |
| Evanston Park | 16 | 13 | $780,000 | $655,000 | $1,199,000 | ▲ +$2,500 (was $777,500, 10 sales) |
| Willaston | 10 | 7 | $765,000 | $600,000 | $1,020,000 | ▲ +$45,000 (was $720,000, 9 sales) |
| Evanston Gardens | 21 | 18 | $728,500 | $630,000 | $980,000 | ▲ +$18,500 (was $710,000, 10 sales) |
| Evanston | 8 | 6 | $703,000 | $590,000 | $800,000 | ▲ +$3,000 (was $700,000, 5 sales) |
| Evanston SouthIndicative only | 1 | 1 | $680,000 | $680,000 | $680,000 | — no previous-period figure (new addition) |
| Gawler WestIndicative only | 3 | 2 | $542,500 | $525,000 | $560,000 | ▼ -$142,500 (was $685,000, 4 sales) |
Gawler East provides the strongest suburb-level reference point because it has the largest disclosed-sales sample in the district — 22 sales at a $782,500 median, down $47,500 on last period's $830,000.
Gawler Belt, Hewett and Gawler South explain the unusual $800,000 headline. All three suburbs posted large, sample-broadened jumps (Gawler Belt from 1 to 9 disclosed sales, Hewett from 4 to 13, Gawler South from 6 to 11), driven by a run of premium large-block sales. The larger samples make these results more meaningful than the previous period, although the medians should still be interpreted in the context of the individual properties that sold.
Willaston is worth a brief mention too — up $45,000 to $765,000, following last period's $31,000 gain, two consecutive periods of strengthening.
Gawler and Gawler West carry only 1–2 disclosed sales each this period and should be read as indicative only — the table above has the detail for anyone tracking those suburbs specifically.
What Is the Price Distribution of Houses Sold in the Gawler District?
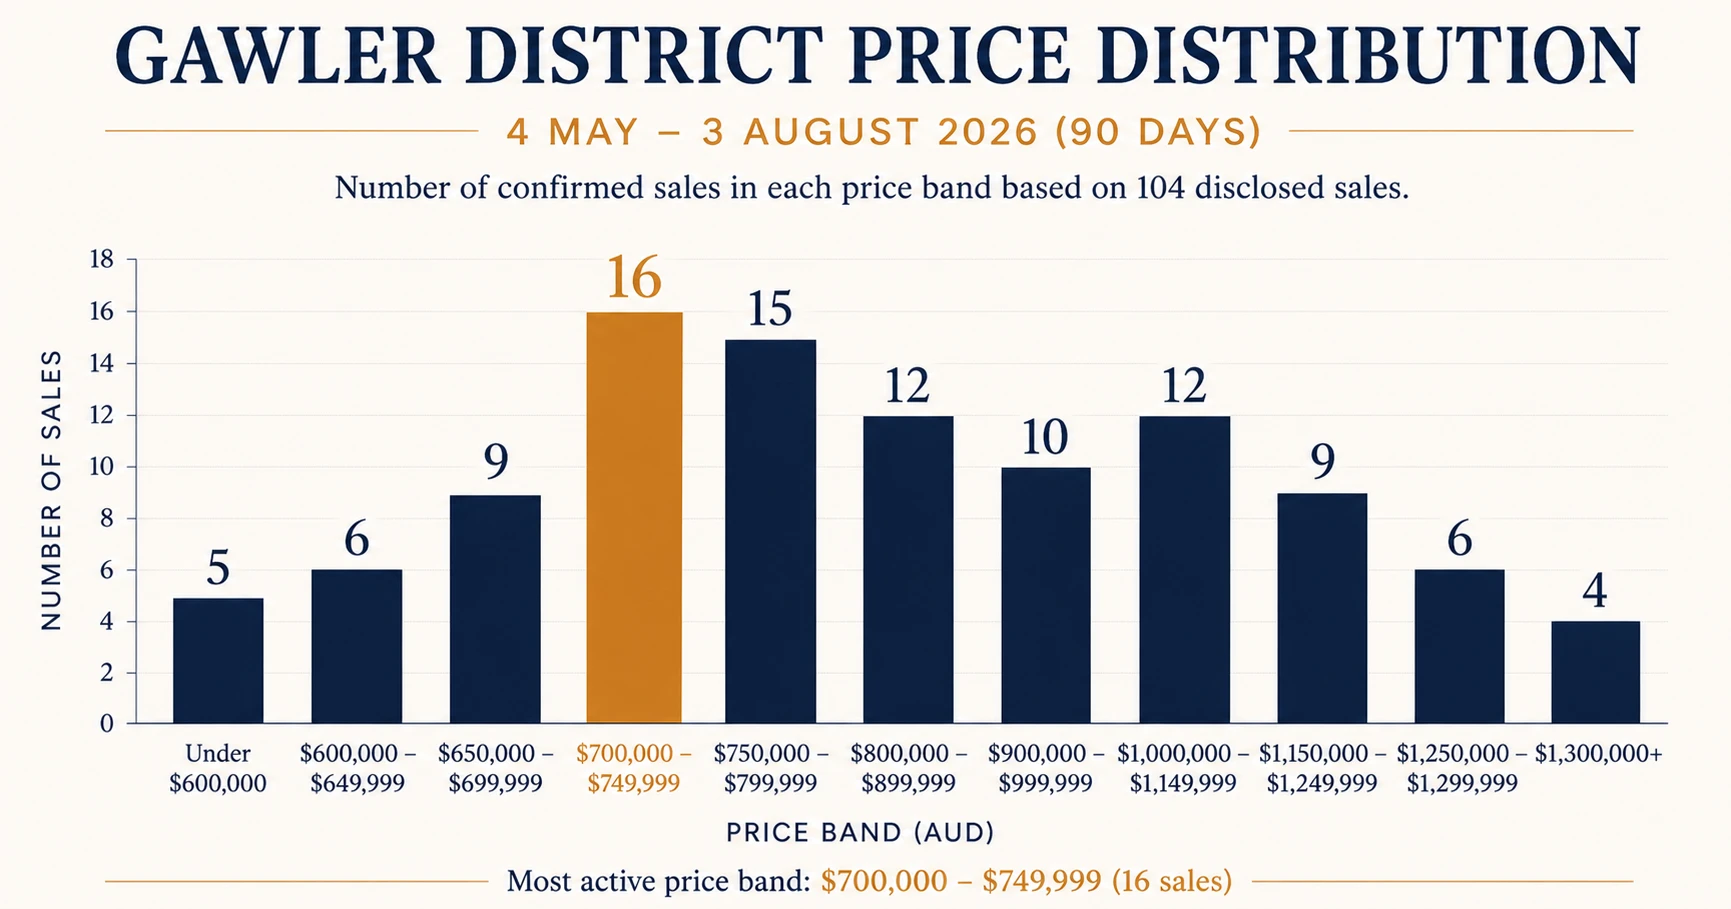
| Price Band | Sales | Market Interpretation |
|---|---|---|
| Under $600,000 | 5 | Lower end of the established-home market |
| $600,000 – $649,999 | 6 | Entry-level established homes |
| $650,000 – $699,999 | 9 | Lower mid-range — several 3-bedroom homes |
| $700,000 – $749,999 | 16 | Most active band — core of the Gawler market |
| $750,000 – $799,999 | 15 | Upper mid-range — larger 3-bedroom and entry 4-bedroom |
| $800,000 – $849,999 | 12 | Quality family homes on good allotments |
| $850,000 – $899,999 | 10 | Larger family homes and renovated period properties |
| $900,000 – $999,999 | 12 | Premium homes on larger blocks |
| $1,000,000 – $1,099,999 | 9 | High-value lifestyle and character properties |
| $1,100,000 – $1,299,999 | 6 | Top end — prestige properties |
| $1,300,000+ | 4 | Exceptional results — Gawler, Gawler Belt, Hewett |
Gawler Property Market — Rolling 90-Day Comparison
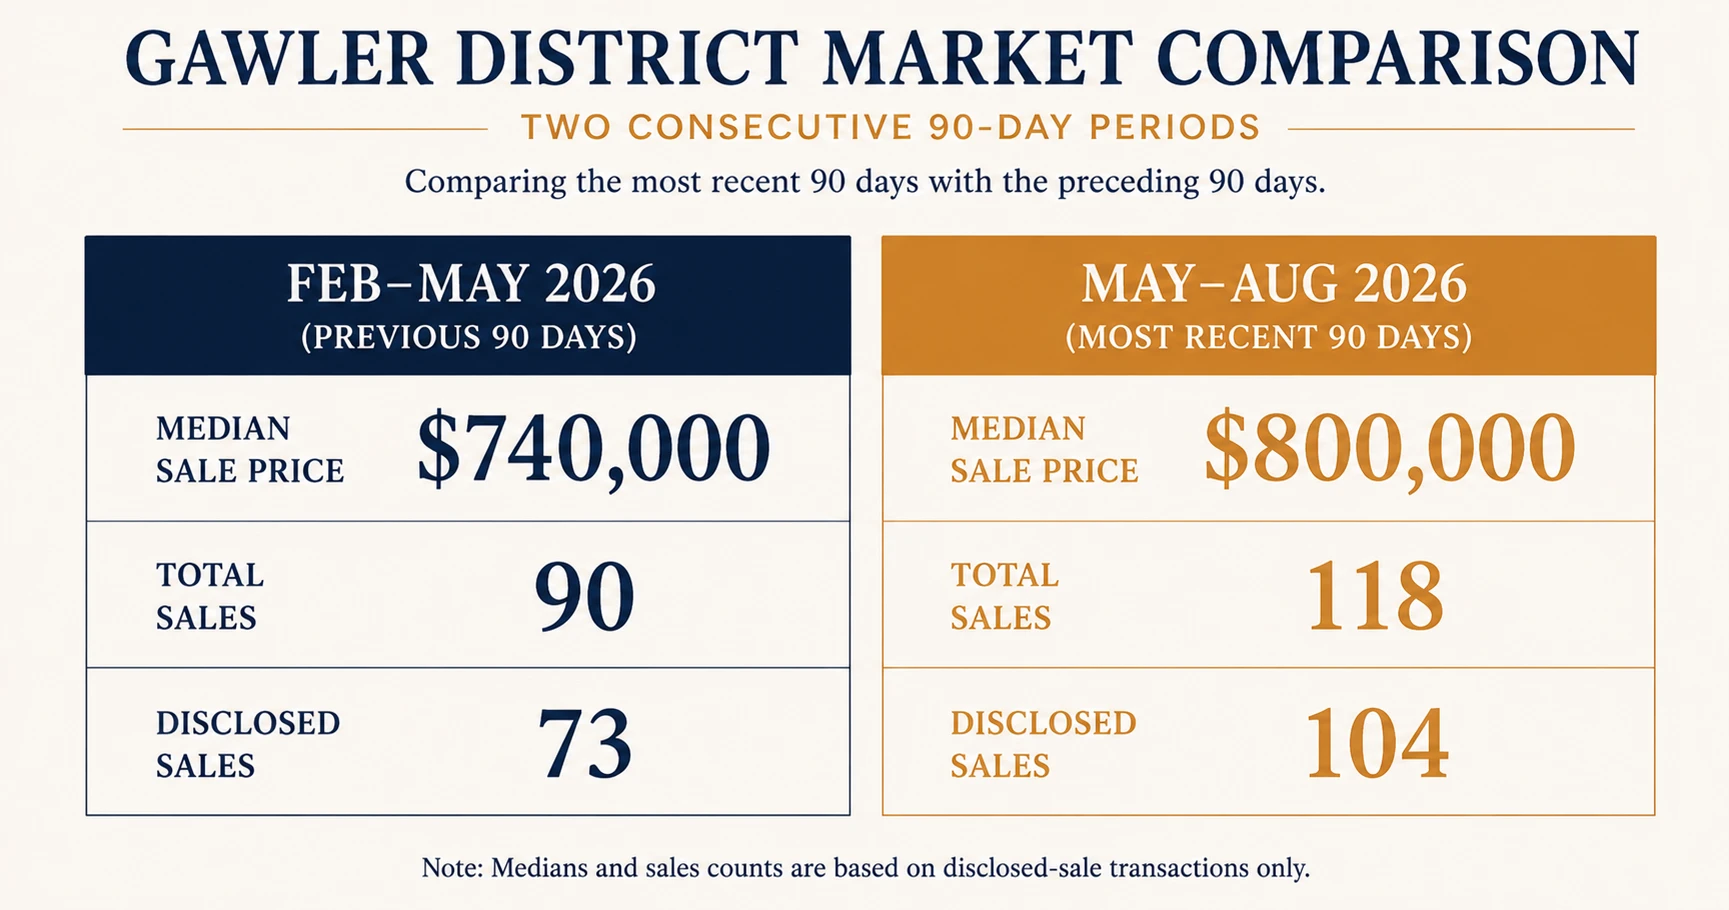
This period spans late autumn through winter, when transaction activity would normally begin to soften. Instead, the May surge and June/July correction during the Budget period dominate the period-on-period comparison.
| Metric | Current Period (May–Aug 2026) | Previous Period (Feb–May 2026) | Change |
|---|---|---|---|
| Report Period | 4 May – 3 Aug 2026 | 4 Feb – 3 May 2026 | — |
| Total Sales | 118 | 90 | ▲ 28 more |
| Disclosed Sales | 104 | 73 | ▲ 31 more |
| Median House Price | $800,000 | $740,000 | ▲ +$60,000 |
| Lowest Sale | $525,000 | $599,900 | ▼ Lower floor |
| Highest Sale | $1,850,000 | $1,300,000 | ▲ New high (Gawler) |
| 3-Bedroom Median | $710,000 | $710,000 | — flat |
| 4-Bedroom Median | $850,000 | $845,000 | ▲ +$5,000 |
| Most Active Band | $700k–$749k | $700k–$799k | Similar core, wider spread |
| Gawler East Median | $782,500 (22 sales) | $830,000 (21 sales) | ▼ -$47,500 |
| Willaston Median | $765,000 (7 sales) | $720,000 (9 sales) | ▲ +$45,000 |
| Hewett Median | $970,000 (13 sales) | $857,500 (4 sales) | ▲ +$112,500 |
The headline read: Total volume rose meaningfully across the full 90-day window — 28 more total sales, 31 more disclosed sales than the previous period. The $60,000 median lift is concentrated in Gawler Belt, Hewett and Gawler South, driven by a cluster of premium large-block sales rather than a district-wide shift. The core 3-bedroom segment held exactly flat while 4-bedroom barely moved — together making up 90 of 104 disclosed sales.
What to watch: The May surge and subsequent June/July correction have now worked their way through this rolling window — the spike, the fall, and the partial July stabilisation are all captured here. The open question heading into the next 90-day period is whether Gawler settles into a genuinely new baseline following the proposed Budget changes, or reverts to its normal seasonal rhythm. The next 90-day period will show whether activity begins to recover as spring progresses, or whether the lower post-May volume becomes the new baseline.
The Range of Sales in the Gawler District — 4 May to 3 August 2026
Rather than list all 118 confirmed sales here, the tables below show the top and bottom of the market — and the range within each bedroom category — so you can see how wide the spread actually is. For every individual sale, download the full dataset below.
⇩ Download the full dataset (Excel — all 118 sales)Top 10 Highest Sales
| Sale Date | Address | Suburb | Bed | Sale Price |
|---|---|---|---|---|
| 06 May 2026 | 59 Cowan Street | Gawler SA | 4 | $1,850,000 |
| 19 May 2026 | 469 Redbanks Road | Gawler Belt SA | 4 | $1,410,000 |
| 29 May 2026 | 4 Morony Drive | Gawler Belt SA | 5 | $1,365,000 |
| 02 Jul 2026 | 63 River View Drive | Hewett SA | 4 | $1,305,000 |
| 12 Jun 2026 | 52 Parkers Road | Gawler Belt SA | 5 | $1,220,000 |
| 16 Jul 2026 | 1 Lange Road | Gawler Belt SA | 4 | $1,200,000 |
| 11 Jun 2026 | 3 Morrow Avenue | Evanston Park SA | 6 | $1,199,000 |
| 20 May 2026 | 11 Irvine Drive | Gawler Belt SA | 4 | $1,162,500 |
| 04 Jun 2026 | 81 Cheek Avenue | Gawler East SA | 3 | $1,150,000 |
| 07 May 2026 | 19 Expedition Drive | Hewett SA | 4 | $1,100,000 |
Top 10 Lowest Sales
| Sale Date | Address | Suburb | Bed | Sale Price |
|---|---|---|---|---|
| 18 May 2026 | 6 Mulga Street | Gawler West SA | 3 | $525,000 |
| 27 May 2026 | 13 Twentyfirst Street | Gawler South SA | 4 | $550,000 |
| 04 Jun 2026 | 27 Mulga Street | Gawler West SA | 4 | $560,000 |
| 06 Jul 2026 | 1/6-8 Farrow Road | Evanston SA | 3 | $590,000 |
| 05 May 2026 | 3 Crosby Avenue | Gawler South SA | 3 | $590,000 |
| 27 May 2026 | 21 Twentythird Street | Gawler South SA | 3 | $600,000 |
| 10 Jun 2026 | 6/33 Drury Street | Willaston SA | 3 | $600,000 |
| 18 Jun 2026 | 32 Bacton Street | Evanston SA | 3 | $600,000 |
| 24 Jun 2026 | 5 Richards Avenue | Gawler South SA | 4 | $620,000 |
| 07 Jul 2026 | 15 Mcewen Road | Evanston Gardens SA | 3 | $630,000 |
The Range Within Each Bedroom Category
The overall top and bottom sales only tell part of the story — a 3-bedroom home and a 5-bedroom acreage property aren't really competing in the same market. The table below shows the cheapest and most expensive sale within each bedroom category this period.
| Bedrooms | Cheapest Sale | Address | Most Expensive Sale | Address |
|---|---|---|---|---|
| 3-Bedroom | $525,000 | 6 Mulga Street, Gawler West | $1,150,000 | 81 Cheek Avenue, Gawler East |
| 4-Bedroom | $550,000 | 13 Twentyfirst Street, Gawler South | $1,850,000 | 59 Cowan Street, Gawler |
| 5-Bedroom+ | $846,000 | 16 Irvine Drive, Gawler Belt | $1,365,000 | 4 Morony Drive, Gawler Belt |
5-Bedroom+ combines the 12 five-bedroom sales and 2 six-bedroom sales this period. For the complete list of all 118 confirmed sales — including every address, date and price — download the full dataset above.
How Does the Gawler Property Market Fit Within Greater Adelaide?
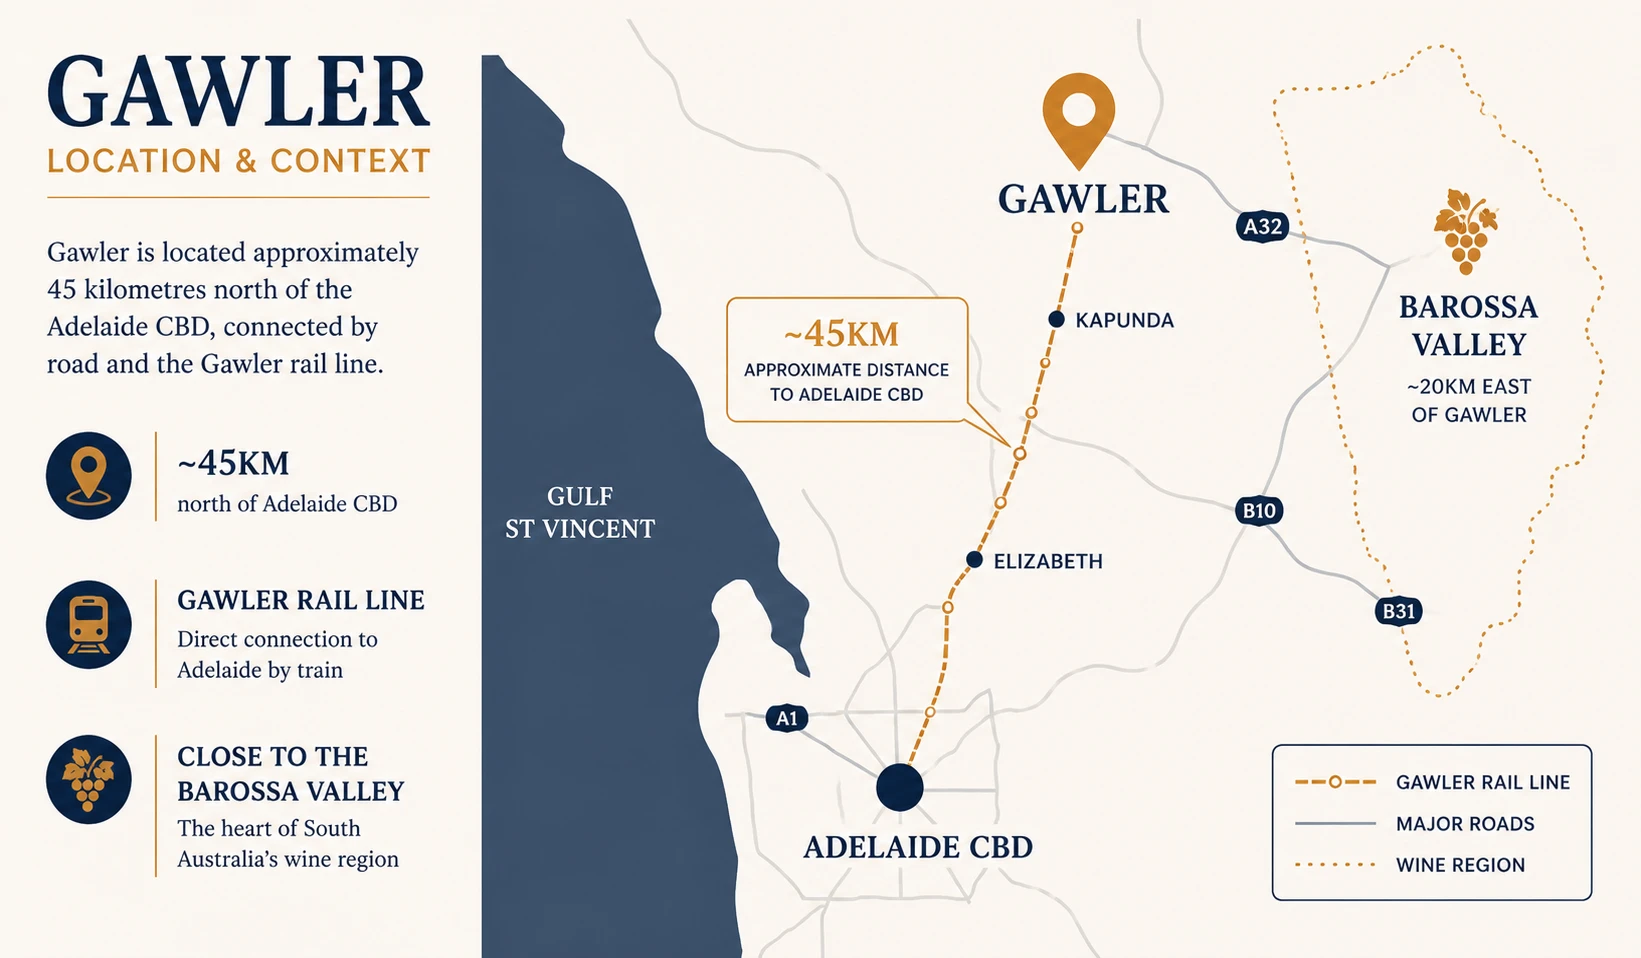
Gawler sits approximately 45 kilometres north of the Adelaide CBD and forms the northern boundary of the metropolitan area. The district is serviced by the Gawler rail line with regular services to the city, making it accessible for commuters while offering significantly more land than comparable inner and middle-ring suburbs.
Gawler can provide an alternative for buyers whose budget no longer stretches as far in some northern Adelaide suburbs, with 3-bedroom homes in the $650,000–$750,000 range still appearing in the district during this reporting period.
Gawler's position as the Gateway to the Barossa is part of what gives the district its particular appeal. Buyers have access to established town amenities, the Barossa Valley to the east and regular rail services to Adelaide, while still finding more space than is available in many closer-in suburbs.
Frequently Asked Questions — Gawler Property Market
$800,000 is the median house price in Gawler SA for the period 4 May to 3 August 2026, calculated exclusively from the 104 publicly disclosed transactions (excluding 14 Contact Agent listings) recorded across the district. For the current month's figure and longer-term price history, see the Gawler house prices pillar page.
118 confirmed residential sales were recorded across the Gawler SA region between 4 May and 3 August 2026, of which 104 disclosed a sale price and 14 were listed as Contact Agent.
$710,000 is the median price of a 3-bedroom house in Gawler SA for the period 4 May to 3 August 2026, based on 44 sales with publicly disclosed prices — exactly flat on the previous period.
$850,000 is the median price of a 4-bedroom house in Gawler SA for the period 4 May to 3 August 2026, based on 46 sales with publicly disclosed prices.
Gawler Belt and Hewett recorded the strongest suburb medians for the period 4 May to 3 August 2026, at $1,162,500 (9 disclosed sales) and $970,000 (13 disclosed sales) respectively. Gawler East provides the strongest suburb-level reference point because it has the largest disclosed-sales sample, with 22 sales at a median of $782,500.
The $700,000–$749,999 band was the most active in the Gawler region for 4 May to 3 August 2026, recording 16 of 104 disclosed sales — 15% of all disclosed transactions. The $900,000+ range combined accounted for a larger share than in the previous period, reflecting the concentration of premium Gawler Belt, Hewett and Gawler South sales this period.
The median moved from $740,000 in the previous period to $800,000 in the current period — a $60,000 rise. This should be read alongside the composition effect driving it: a cluster of high-value Gawler Belt, Hewett and Gawler South sales. The core 3-bedroom segment held exactly flat at $710,000, while 4-bedroom moved only $5,000. The clearest interpretation is that core family-home pricing has held steady, rather than the district experiencing a genuine $60,000 uplift in values.
House prices in Gawler SA are influenced by suburb location, land size, number of bedrooms, property condition, time of year and current buyer demand. This period also illustrates how policy announcements — such as the 2026 Federal Budget's changes to negative gearing and capital gains tax — can materially affect short-term transaction volume and, in turn, the composition of what sells and at what price.
The most accurate way to find out what your property is worth in the Gawler SA market is a free appraisal from a local agent with direct knowledge of recent comparable sales in your street. Andrew McKiggan from Gawler East Real Estate provides free property appraisals in Gawler SA with no obligation, based on the same confirmed sales data published in this report.
Related Reading
The median tells you what sold across the district. It doesn't tell you what your home is worth.
This report shows a $140,000 gap between the 3-bedroom and 4-bedroom medians, a suburb-to-suburb spread from $542,500 in Gawler West to over $1,000,000 in Gawler Belt and Hewett, and a stronger concentration of high-value sales than in the previous period. That's not noise — it's the whole point. Every home in the Gawler district sits somewhere specific within these numbers, shaped by its suburb, its bedroom count, its allotment, and its condition, and no district-wide median can tell you where your specific property falls.
That's exactly what an individual appraisal is for. Rather than starting from a headline figure and adjusting for guesswork, Andrew McKiggan builds every appraisal from a structural comparison against recent local sales that are genuinely comparable to the property — using the same characteristics that drive buyer decisions at the foundational level: suburb, bedroom count, land size, condition and presentation. It's the same confirmed sales data published in this report, applied specifically to your street.
At Gawler East Real Estate, that appraisal comes with 1.5% commission or lower and no hidden fees.