
Gawler House Prices in 2026 — Where the Market Stands
Gawler House Prices — At a Glance
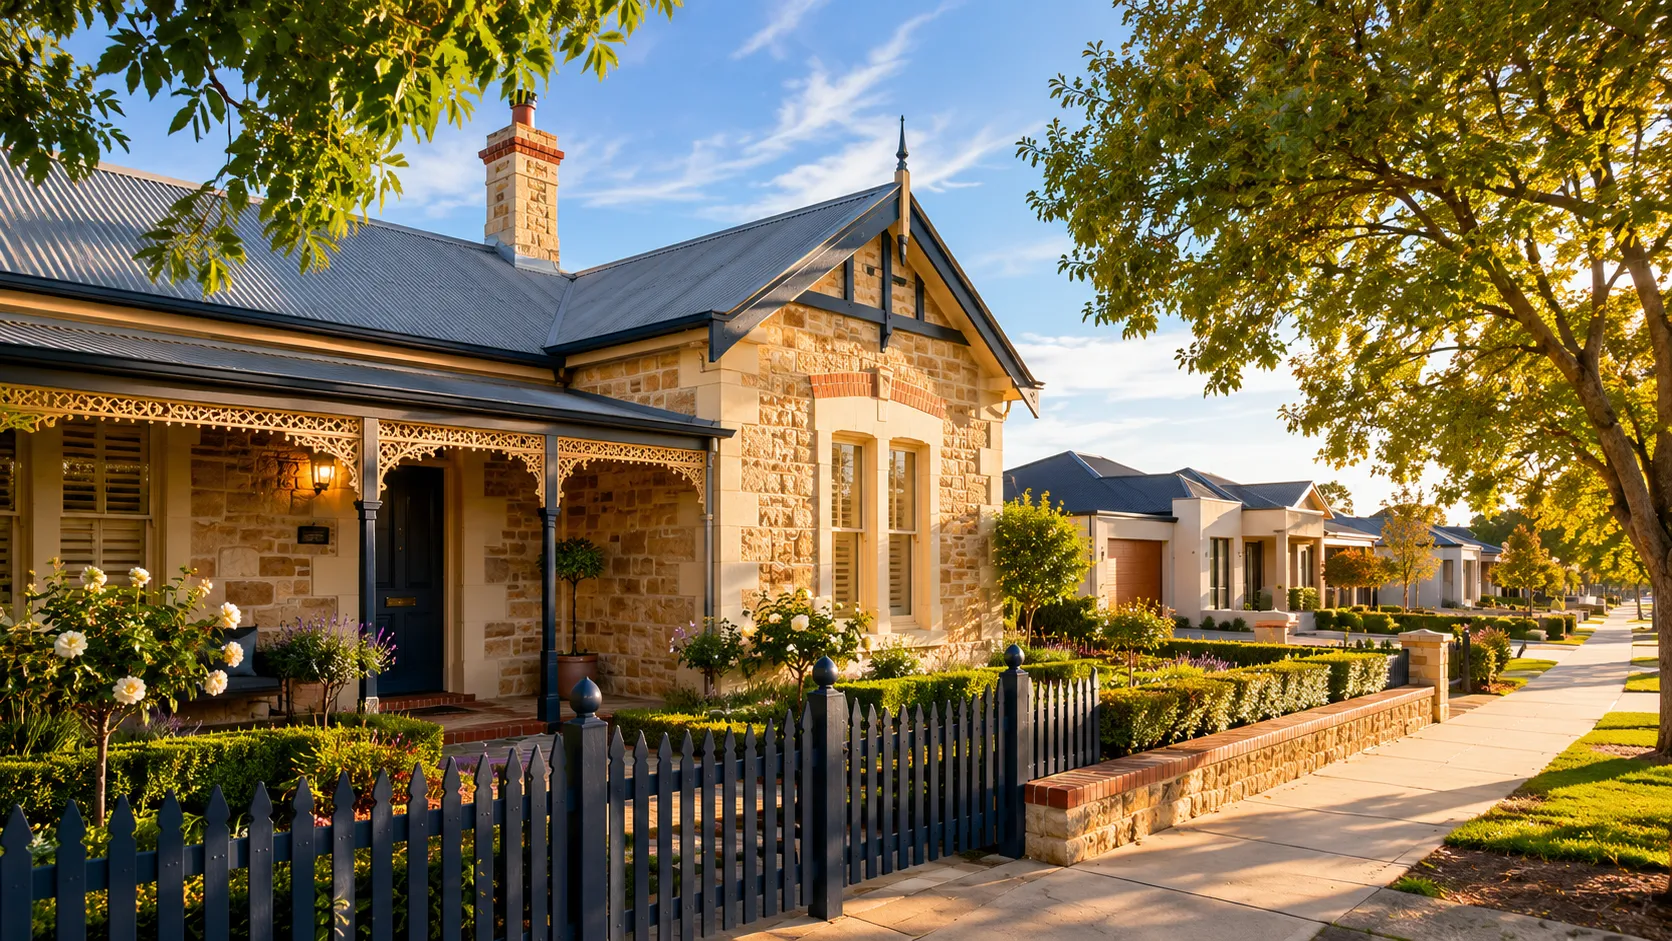
$810,000
JULY DISTRICT
MEDIAN
$800,000
90-DAY ROLLING
MEDIAN
$767,000
JULY 3-BEDROOM
MEDIAN
27
CONFIRMED
JULY SALES
~230
ACTIVE 3+ BED
STOCK
Gawler house prices currently sit at a district median of $810,000, based on 27 confirmed sales between 4 July and 3 August 2026. That's up from June's $782,500, but the movement appears to reflect the mix of properties that sold rather than a broad lift in values. The 3-bedroom median also moved for the first time in three months, from a $700,000–$710,000 range to $767,000, although that figure is based on only nine disclosed sales. At the same time, both active stock and sales volume have eased for two consecutive months since May's peak — a more cautious signal than a market simply rebalancing.
But there's a bigger question behind the local numbers: is the recent softening being reported across Adelaide also showing up in Gawler? Adelaide's median house price fell 0.6% in July to $1.011 million — the city's second consecutive monthly decline, and 0.7% below its May peak — according to REA Group's August Home Price Index. Gawler's confirmed local sales data shows a broadly similar direction over the same period — July sales eased further to 27, extending a two-month decline from May's peak, while active stock across the district and surrounding areas eased to approximately 230 listings. That doesn't mean Gawler is following Adelaide's exact trend; it means the local data needs to be examined rather than assuming the metropolitan headline tells the whole Gawler story.
Andrew McKiggan (RLA248695) at Gawler East Real Estate compiles this report monthly from confirmed realestate.com.au sold records and provides free property appraisals across all Gawler district suburbs — with 1.5% commission or lower and no hidden fees.
Gawler District — Current House Prices
Last updated August 2026 · Based on confirmed sales 4 July to 3 August 2026 · Updated monthly
| Market Indicator | Current Figure |
|---|---|
| Median House Price | $810,000 |
| 3-Bedroom Median | $767,000 |
| Most Active Price Band | $800,000–$849,999 / $900,000–$999,999 (tied) |
| Total Sales (July 2026) | 27 confirmed sales |
| Market Condition | Easing — sales and active stock both down for a second consecutive month |
Want the full suburb-by-suburb breakdown?
This page tracks the current monthly figure. Our annual review compares growth, sale volume, and market reliability across the Gawler district and selected surrounding areas.
Gawler Property Market — What Sold in July 2026
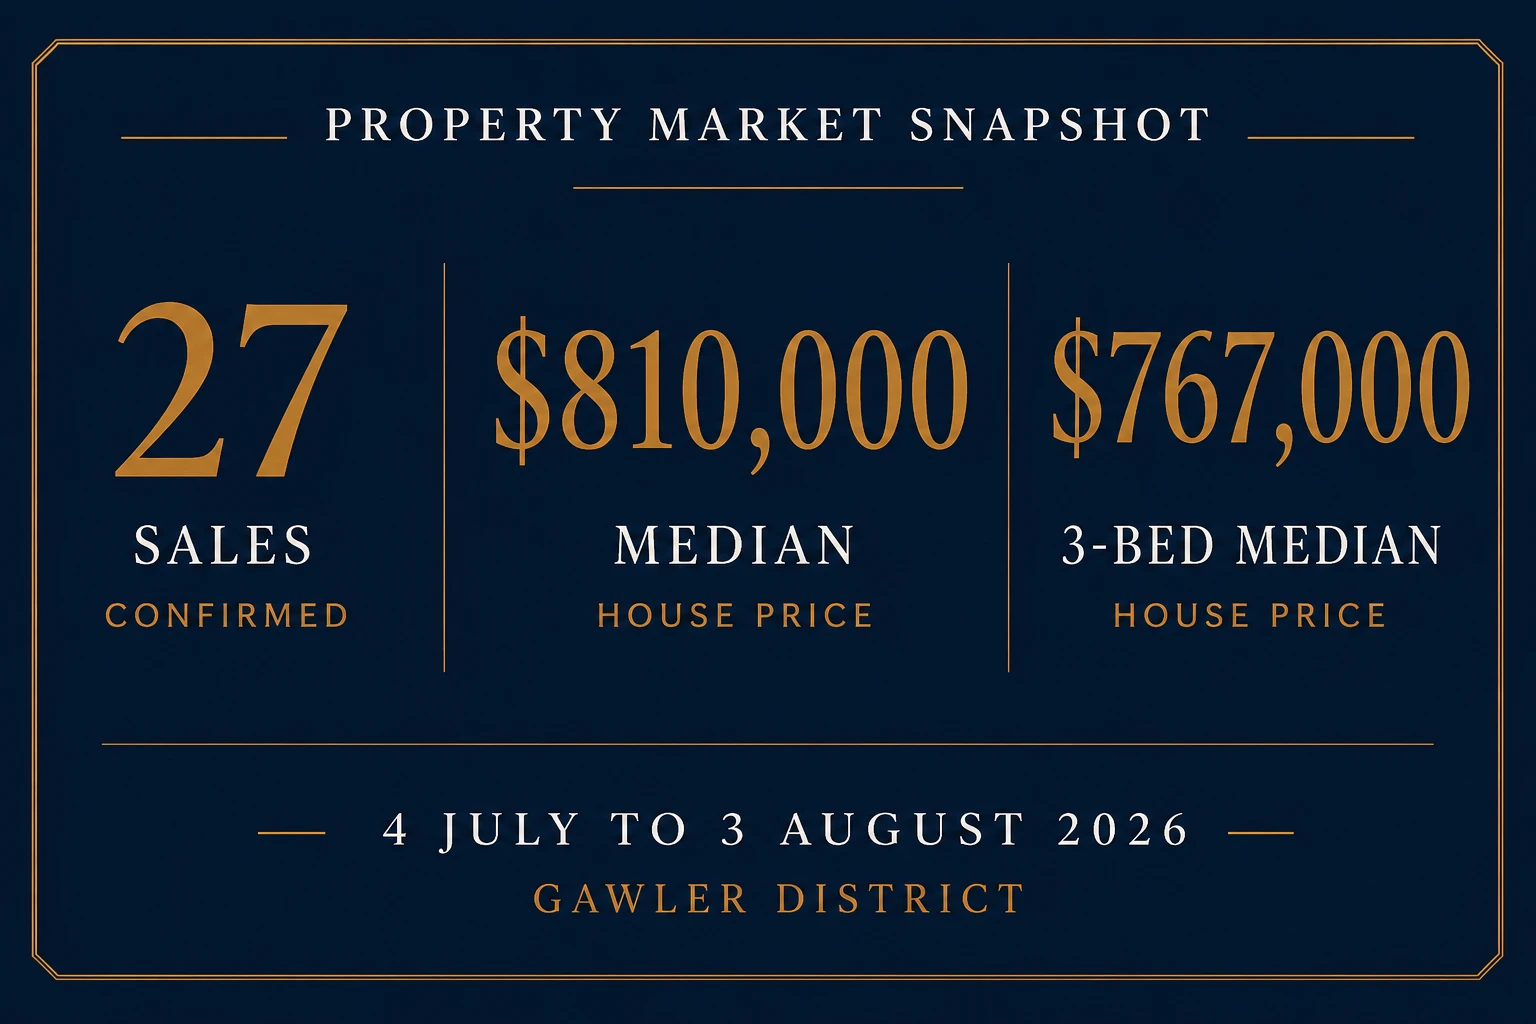
The Gawler district recorded 27 confirmed residential sales between 4 July and 3 August 2026 — down from June's 36, and now 16% below April's baseline of 32. Of those, 19 disclosed a sale price, producing a district median of $810,000. The core Gawler district used for this dataset covers 10 suburbs: Gawler, Gawler East, Gawler South, Gawler West, Hewett, Willaston, Evanston, Evanston Gardens, Evanston Park and Gawler Belt. Angle Vale and Munno Para are tracked separately as surrounding growth areas and aren't included in the Gawler district median or sales totals.
This is the second consecutive month where both sales activity and active stock have eased together — a different pattern to April through June, where either sales or stock, but not both, was moving in the same direction at once. Two consecutive months of both figures falling together is a more consistent signal of a genuinely quieter market than any single month on its own.
Supply has eased for the second consecutive reading. Approximately 230 houses with three or more bedrooms were listed across the district and surrounds as of early August 2026 — down from around 243 in early July, and from May's peak of 246. Whether that decline reflects fewer new vendors listing, more of the existing stock selling, or a combination of both isn't yet clear from two months of data.
For the full breakdown of every confirmed sale this period, see the Houses Sold in Gawler — July 2026 monthly report.
Gawler House Prices — 90-Day Rolling View
A single month's median can be pulled around by which specific properties happened to sell — Hewett having three sales instead of six, or one acreage sale landing in the window. The 90-day rolling figure combines a much larger number of transactions and gives a steadier read on where prices are actually sitting right now.
| Market Measure | Latest (4 May–3 Aug 2026) |
|---|---|
| 90-day confirmed sales | 118 |
| Disclosed sale prices | 104 |
| 90-day rolling median | $800,000 |
| 3-bedroom rolling median | $710,000 |
| Previous rolling median (4 Feb–3 May) | $740,000 |
| Movement | ▲ +$60,000 (+8.1%) |
The rolling median of $800,000 sits close to May's monthly figure and above both June's and April's — a reflection of just how much May's exceptional month weighs on a 90-day window that includes it. As the window rolls forward past May in the coming months, this figure is likely to move again regardless of what August and September actually do, simply because May's unusually strong month will drop out of the calculation.
For the full breakdown of every sale behind this figure, see the Gawler Property Market Update — 4 May to 3 August 2026.
Monthly = latest snapshot. 90-day rolling = broader current trend. Annual/suburb data = longer-term context. Each answers a different question — this page uses all three, pointing to the dedicated reports for full detail on each.
How Gawler House Prices Have Changed
Gawler's median house price moves for two different kinds of reasons, and it's worth telling them apart. Some movement is genuinely about the district's underlying value — the kind of change an annual suburb-growth comparison is built to measure. Most month-to-month movement, though, is about which specific properties happened to sell in a given four-week window — a different mix of suburbs, bedroom counts and price points, not a different market.
The three data sources on this site are built to separate these two effects:
- The monthly report shows exactly what sold in a given period — useful for a current snapshot, but the most exposed to composition effects from a small sample.
- The 90-day rolling report combines roughly three months of sales, smoothing out most of the month-to-month noise while staying current.
- The annual suburb comparison tracks genuine year-on-year growth by suburb, the closest thing on this site to a measure of underlying value change rather than sales-mix noise.
Reading the monthly figure without this context is the most common way to misread the Gawler market — a strong or weak month says more about what sold than about what happened to prices.
Why Gawler House Prices Can Be Misleading — The Dual-Speed Market
Before reading any Gawler price figure, this is the most important thing to understand: Gawler does not operate as a single uniform market.
The district runs at two different speeds, with two different price drivers:
The Historic Township Core
Church Hill and Gawler Central — heritage overlays, period stone cottages, low transaction volumes. A handful of sales can move the suburb median significantly in either direction, not because values have shifted, but because the sample is too small to carry statistical weight.
The Growth Corridors
Gawler East, Evanston Gardens, Evanston Park and surrounding areas — modern master-planned housing, consistent buyer activity, affordability-driven demand. Gawler East has regularly accounted for around 25–30% of district sales in the monthly data, giving its median more statistical weight than the low-volume historic core.
That divide shows up clearly in the annual figures too — over the past 12 months, Gawler East (one of the growth corridors above) grew +13.1%, while Gawler township itself, sitting in the low-volume historic core, fell -10.9% on just 15 sales. See the full 2026 Suburb Growth Comparison for the complete eleven-suburb breakdown, including Hewett's standout +22.5% result.
A suburb median based on 2 sales is not the same signal as one based on 12. The district-wide headline median must always be read alongside the sale count and the price band distribution. For a detailed structural analysis of the Gawler market including development pipeline, commute infrastructure and long-term demand drivers, see our Gawler Property Market Overview.
What Is the Median House Price in Gawler SA?
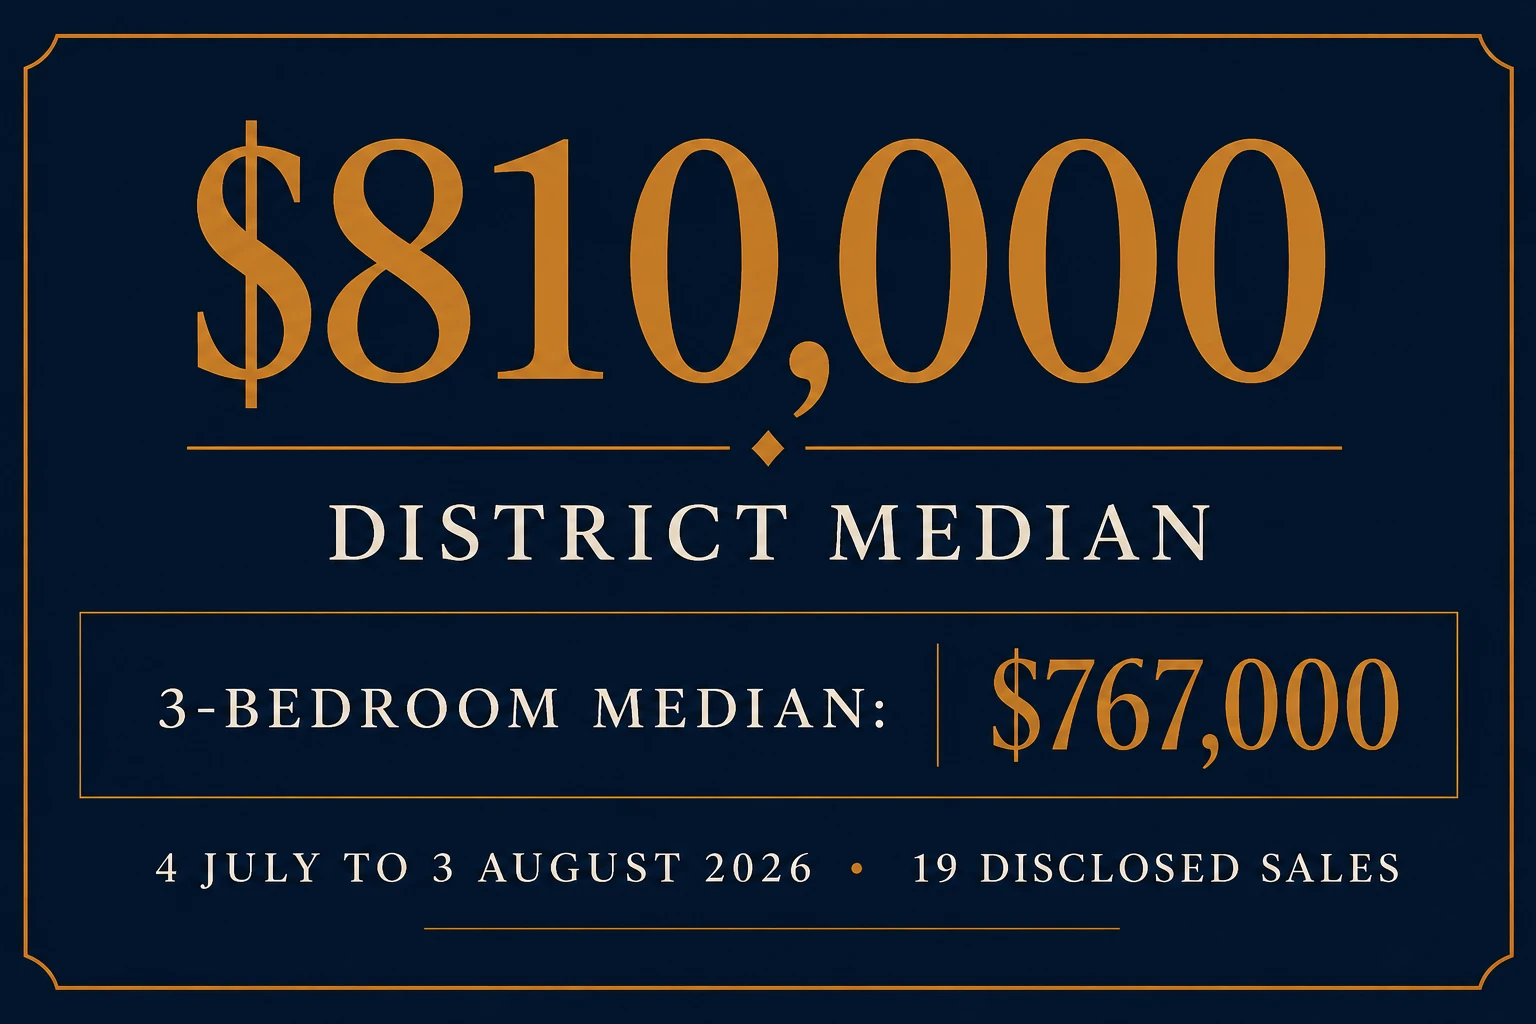
The current district median is $810,000 — based on 27 confirmed sales between 4 July and 3 August 2026, with 19 disclosing a sale price. That's up $27,500 from June's $782,500 — the smallest of the three month-to-month movements in this series (May's rise from April was $82,250; June's fall from May was $17,500) — and, as with every month in this series, it reflects a genuinely different mix of stock rather than a broad lift in values.
This figure is compiled from confirmed sold listings on realestate.com.au rather than an automated property estimate. Automated estimates are algorithm-generated and can differ from confirmed settlement prices, which is why this report uses completed sales as its primary source.
But here is what the headline number alone won't tell you:
The composition shift. Hewett continued to record premium-priced sales for a third consecutive month, Gawler South produced its strongest showing this series, and fewer entry-level sales balanced the top end. Together, that mix pulled the headline figure up without signalling a broad repricing — see the July monthly report for the full breakdown of what drove the number.
The band has moved, not just the median. $700,000–$749,999 — the district's most active band in every prior month of this series — recorded just 1 of 19 disclosed sales in July. Activity concentrated instead in two adjacent bands, $800,000–$849,999 and $900,000–$999,999, tied with 4 sales each — the first time a band above $800,000 has led the month, and the first genuine tie for most active band in this series.
The headline median tells you what the full range sold for.
The price band distribution tells you where the market actually operates. The three-bedroom median is one of the most useful benchmarks for typical Gawler housing, because it removes some of the distortion caused by large differences in property size and type. It sat in a tight $700,000–$710,000 range across April, May and June from 50 combined disclosed sales — then moved to $767,000 in July from 9 disclosed sales. That's the first genuine movement in this series' most reliable indicator, though with only nine sales behind it, it's better treated as a signal to watch heading into August than a confirmed new benchmark.
What Is the Price Distribution of Houses Sold in the Gawler District?
Most Gawler district home sales in July 2026 fell within two tied price bands, $800,000–$849,999 and $900,000–$999,999 — 4 of 19 disclosed sales each, 21% of all disclosed transactions apiece. That's a genuine shift from every prior month in this series, where $700,000–$749,999 had consistently led. The full breakdown below shows where transactions are actually occurring across the district, which is more useful for buyers and sellers than any single median figure.
| Price Band | Sales | Market Interpretation |
|---|---|---|
| Under $600,000 | 1 | Entry-level — Evanston |
| $600,000–$649,999 | 1 | Entry-level — Evanston Gardens |
| $650,000–$699,999 | 1 | Entry-level — Evanston Gardens |
| $700,000–$749,999 | 1 | Previously the district's most active band — thin this month |
| $750,000–$799,999 | 3 | Upper mid-range — Hewett, Gawler East, Evanston Gardens |
| ★ $800,000–$849,999 | 4 | Tied most active band — Gawler East, Evanston Gardens, Evanston Park, Evanston |
| $850,000–$899,999 | 3 | Gawler South, Hewett |
| ★ $900,000–$999,999 | 4 | Tied most active band — 21% of all disclosed sales |
| $1,000,000–$1,099,999 | 0 | No confirmed sales this period |
| $1,100,000–$1,299,999 | 1 | Top-end — Gawler Belt |
| $1,300,000+ | 0 | No confirmed sales this period |
| Total | 19 | Disclosed sales — 4 July to 3 August 2026 |
The concentration has moved up the price scale. The combined $750,000–$999,999 range accounted for 14 of 19 disclosed sales — 74% of all disclosed sales. In June, the equivalent concentration sat in the $700,000–$799,999 range.
Are Gawler House Prices Rising or Falling? — May, June and July 2026 Compared
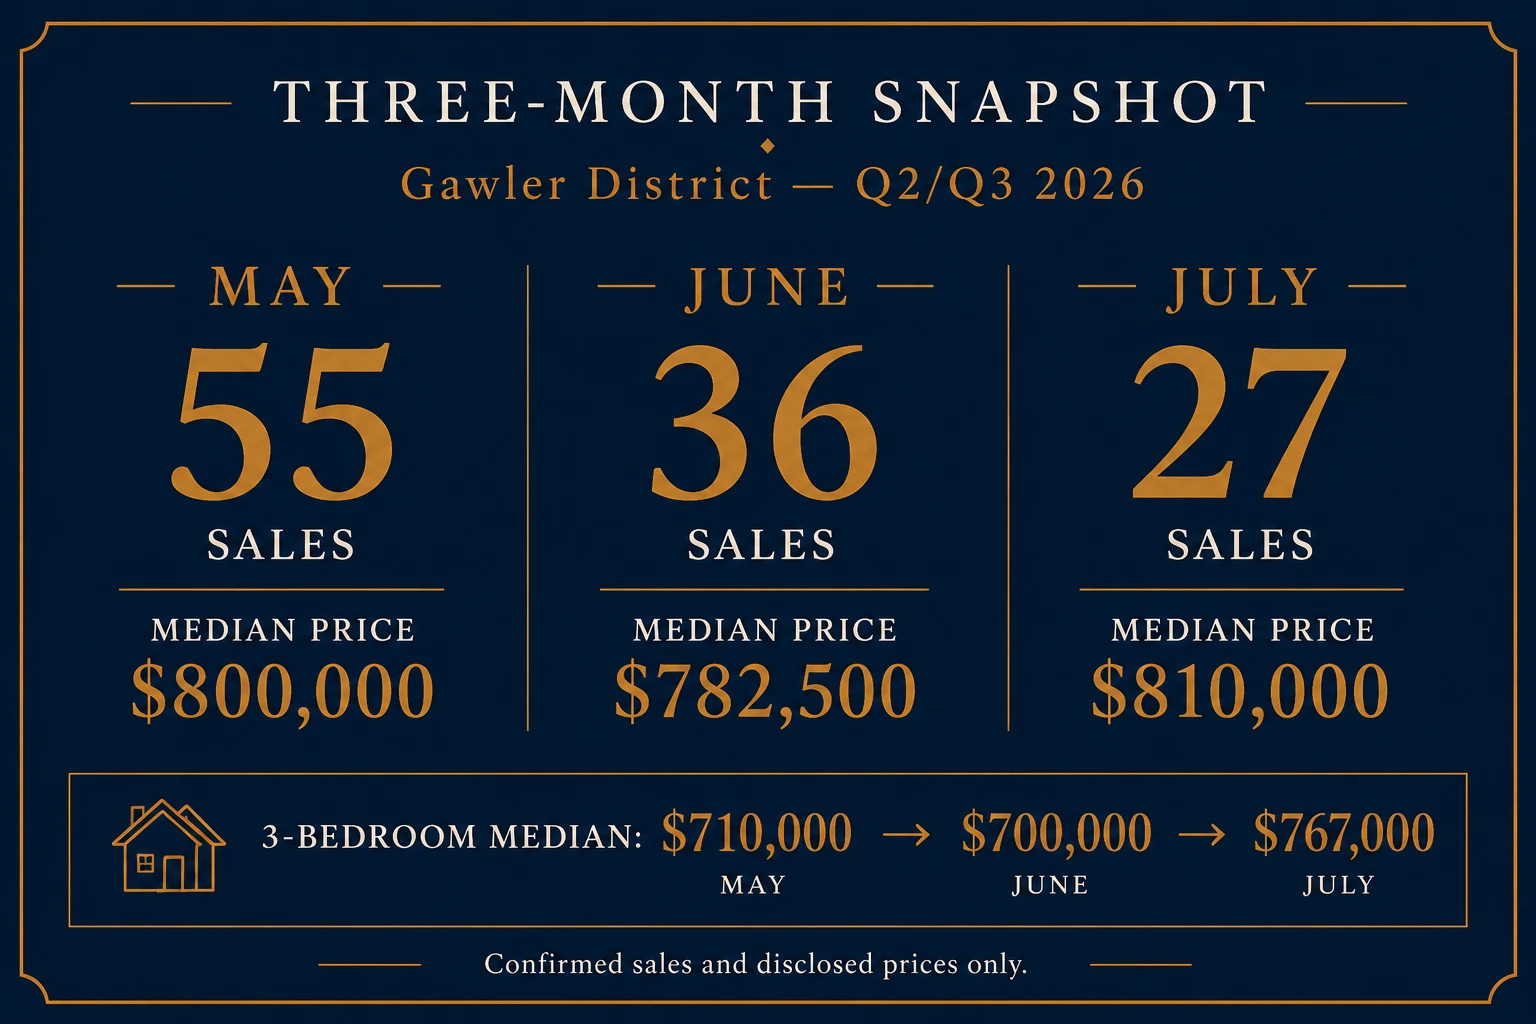
The core 3-bedroom median moved for the first time in July 2026, following three months sitting within a tight $700,000–$710,000 range. The headline district median has moved $800,000, $782,500 and $810,000 across May, June and July, reflecting which suburbs and price tiers happened to transact each month rather than a single clean trend line. Total sales volume, by contrast, has declined for two consecutive months — from May's 55 to June's 36 to July's 27 — a clearer signal than the median's month-to-month composition noise.
| Metric | May 2026 | June 2026 | July 2026 | Trend |
|---|---|---|---|---|
| Total Sales | 55 | 36 | 27 ▼ | Declining for two consecutive months |
| Disclosed Sales | 53 | 32 | 19 | — |
| Median House Price | $800,000 | $782,500 | $810,000 | Composition-driven |
| 3-Bedroom Median | $710,000 | $700,000 | $767,000 ▲ | First real move in the series |
| 4-Bedroom Median | $932,750* | $757,500 | $852,500 | Composition-driven |
| Most Active Band | $700k–$749k | $700k–$749k | $800k–$849k / $900k–$999k (tied) | Shifted up |
| Gawler East Median | $763,500 (14) | $899,500* (6) | $787,500 (2) | Thin sample Jul |
| Hewett Median | $1,008,000 (6) | $1,055,350 (3) | $905,000 (4) | Premium-priced three consecutive months |
| Stock (3+ bed listed) | ~238 | ~243 | ~230 | ▼ Easing after peak |
* May's 4-bed median reflects nine sales above $1,000,000 spread across Hewett, Gawler Belt and other suburbs. June's Gawler East median is pulled upward by two results above $1,000,000 ($1,150,000 and $1,065,000) — the remaining four Gawler East sales ranged $712,500–$932,000. July's Gawler East and Hewett medians are both from small samples (2 and 4 disclosed sales respectively) and should be read as indicative rather than definitive.
The three-month picture resolves what a single month cannot, but it also shows a genuine change of character. $700,000–$749,999 was the most active price band without exception across April, May and June — then July's activity concentrated in two higher tied bands instead, with the old core band recording just 1 of 19 disclosed sales. That's the first time this series has recorded such a pronounced shift in where disclosed sales were concentrated, rather than simply a movement in the headline median.
What the 4-bedroom swing is actually telling you. May's $932,750 4-bedroom median reflected nine sales above $1,000,000 spread across multiple suburbs. June's $757,500 reflected a smaller premium tier — just two sales above $1,000,000. July's $852,500 sits between the two, from 6 disclosed sales ranging $750,000 to $1,200,000. Three months, three different figures — the 4-bedroom segment remains the least stable of the three bedroom categories in this series, and no single month's result should be treated as the new benchmark.
How Has the 2026 Federal Budget Affected Gawler House Prices?
The 2026 federal budget was followed by a temporary spike in Gawler sales volume in May, followed by two consecutive months of cooling through June and July: April 32 → May 55 → June 36 → July 27.
Two months ago we set a test: if volumes held above roughly 25–30 sales a month after May, the budget-driven surge would look like it was sustaining activity rather than simply pulling buyers forward. June came in at 36 — comfortably above that threshold, which did not support a clean pull-forward story on its own. July changes the picture again: at 27 sales, volume has now eased for a second consecutive month and sits below April's baseline of 32.
The most likely explanation is a genuine pull-forward effect in May — May's premium-tier activity has not been repeated at the same level since the surge — combined with an independent seasonal cooling now running deeper than a typical winter. Whether that reflects fewer premium properties transacting, changes in buyer activity, or a combination of both isn't yet clear from the available sample. August will provide another useful data point in determining whether the July decline represents a broader change in activity or short-term volatility in a relatively small market.
What remains is a genuinely quieter market on both sides — fewer confirmed sales, against a shrinking stock pool. Whether that's a real softening beyond the pull-forward reversal, or two months of a smaller sample producing atypical results, isn't yet clear from two months of data.
Easing stock, easing sales — what this means for vendors right now
Approximately 230 houses with 3+ bedrooms were listed across the Gawler district and surrounds as of early August 2026 — down from around 243 in early July, and from May's peak of 246. This is the second consecutive month active stock has fallen, alongside a second consecutive month of falling sales.
A property launching now is competing against fewer alternatives than it would have in May or June — but a smaller active buyer pool is a factor working the other way. What that nets out to for an individual property still depends heavily on its local comparable sales and how buyers respond to the asking price.
For the full analysis, see: 2026 Federal Budget — Gawler Property Market Analysis.
Hewett House Prices — Continued Premium Position
Hewett has recorded a premium-priced median for three consecutive months: $1,008,000 in May from 6 disclosed sales, $1,055,350 in June from 3 disclosed sales, and $905,000 in July from 4 disclosed sales. Across the three months, the suburb's highest individual sale has also stayed elevated — up to $1,100,000 in May, $1,305,000 in June (the district's highest sale that month, and a genuine residential result rather than rural acreage), and $970,000 in July.
Each month's figure comes from a relatively small disclosed sample, so none of these medians alone proves much on its own. But the consistency across three consecutive months — every one sitting above $900,000 — is a more useful signal than any single month's result. Hewett has continued to record premium-priced transactions across three consecutive monthly reports, rather than a single strong month followed by a quiet one.
Hewett in context
Three consecutive months of medians above $900,000, each from a different small sample of disclosed sales. Hewett remains the district's clearest premium suburb by this measure.
Angle Vale House Prices — A Key Surrounding Market
Angle Vale is tracked separately from the core Gawler district dataset because of its larger acreage component and different development profile, but it's a genuinely important surrounding market for anyone researching the broader Gawler area. It currently has 56 properties listed for sale — more stock than any suburb in the core district — giving buyers a larger pool of active listings here than in any other suburb currently tracked in this report. The median house price sits at $837,000, up 10.0% over the past 12 months, Angle Vale's first year included in this report.
Angle Vale is one of the largest and most distinctive surrounding areas in the dataset, spanning over 14 square kilometres, with particularly strong population growth in the surrounding Gawler corridor — up 38.6% since 2016. Its premium median reflects larger blocks and a lifestyle-acreage feel that sets it apart from the more compact growth-corridor suburbs nearby.
Sales here move noticeably slower than the district average, at 39 days on market. This average sits across a mix of property types and price points, so a specific property's likely timeframe will depend on its own price band and presentation rather than the suburb-wide figure alone.
Angle Vale in context
56 properties listed — the most of any suburb. Median $837,000, up 10.0% in 12 months. With new estates still being released, Angle Vale remains an important surrounding market for buyers looking for newer housing and larger blocks without the price point of some established suburbs. For the full picture see our Angle Vale House Prices report.
What Is the Best Time to Sell in Gawler?
The current stock position is less vendor-crowded than it was in June: approximately 230 houses with 3+ bedrooms are active, while 27 confirmed sales were recorded in July. Both active stock and confirmed sales have eased for two consecutive months. Well-priced, well-presented properties remain better positioned to attract attention and compete effectively, though a smaller buyer pool alongside lighter competition is a more mixed picture than falling stock alone would suggest.
Spring historically brings stronger buyer volumes to the Gawler district — roughly September through February. But spring also brings significantly more vendor competition. The current window, while still quieter than spring, has the advantage of less competition from other sellers than either spring or May's surge produced. A property that launches now with clear pricing, realistic expectations and strong first-week presentation is competing against fewer alternatives than at any point since May.
Hewett's premium pricing has held for three consecutive months — evidence that well-presented premium properties are still finding buyers through a quieter winter market.
For the full timing framework — including the Property Clock and why stock levels in your specific price bracket matter more than the season — see our Best Time to Sell a House page.
Listing Strategy Mistakes We Are Currently Seeing in the Gawler Market
Stock has eased for two consecutive months, and buyer activity has eased alongside it — a genuinely quieter market than June's, and the mistakes below matter more, not less, in this environment. How a property is listed and priced still has a direct impact on how many buyers see it, and these four can cost vendors time and weaken their negotiating position.
Will Gawler House Prices Fall? What the Data Can and Can't Tell Us
June's report asked whether falling sales volume would translate into falling asking prices or simply longer selling times. July's answer, cautiously: not yet, but the underlying volume trend hasn't reversed either. Sales eased further to 27 — a second consecutive monthly decline — while the 3-bedroom median moved up for the first time in the series and active stock also kept falling. A rising 3-bedroom median alongside falling sales volume is not the clean "days on market stretch out" signal June's result seemed to point toward, but it isn't a clean all-clear either.
Two consecutive months of declining sales volume is a more meaningful signal than any single month — and the 3-bedroom median's move to $767,000 rests on only 9 disclosed sales, a small enough sample that it could just as easily represent which specific properties happened to sell in July as a genuine repricing.
What's changed since June is the shape of the risk. In June, the open question was whether a smaller buyer pool against rising stock would eventually force prices down. In July, both stock and sales fell together for the first time in this series — the more relevant question now is whether that reflects a genuinely tightening market, or two consecutive months of a smaller sample producing atypical results. Those have different implications: the first suggests real softening in underlying demand; the second suggests July and June were partly noise that won't repeat in August.
If August's sales keep falling
A third consecutive month of declining sales volume, alongside stock stabilising or continuing to fall, would provide considerably stronger evidence that the market is genuinely cooling rather than experiencing short-term volatility in a small sample.
If August's sales stabilise or recover
A rebound in sales volume back toward June's level, or beyond, would point toward June and July being two months of atypical volatility rather than a structural cooling — in which case the current 3-bedroom median move would also warrant re-checking against a larger sample before treating $767,000 as an established new benchmark.
Two months of cooling now point the same direction — but two months is still early
July's continued decline in sales, alongside the first 3-bedroom median movement in the series, are consistent with each other — but consistent isn't the same as confirmed. August's data will show whether sales volume stabilises, whether the 3-bedroom median holds near $767,000 or drifts back toward $700,000–$710,000, and whether the market is genuinely cooling or two months reflect short-term volatility in a relatively small sample.
This page is updated monthly with confirmed sales data as it arrives. In the meantime, if you are a vendor or buyer currently active in the Gawler market and want a read on what the current data means for your specific property or suburb, Andrew McKiggan is available for a free, no-obligation consultation — no forecasts, just the current data applied to your situation.